
Estimates of current and future usage
—
Estimates of current and future usage
[Since v1.3, the motd feature has served as a usage counter. This upsets some people even though it can be disabled. Here's an explanation of why this is on by default.]
Our usage data gives us some good information about the open source contributor funnel. As of October 2021, it seems to break down this way:
- ~3000 monthly users
- ~300 daily users
- ~30 community members
- ~3 regular contributors
Usage Growth
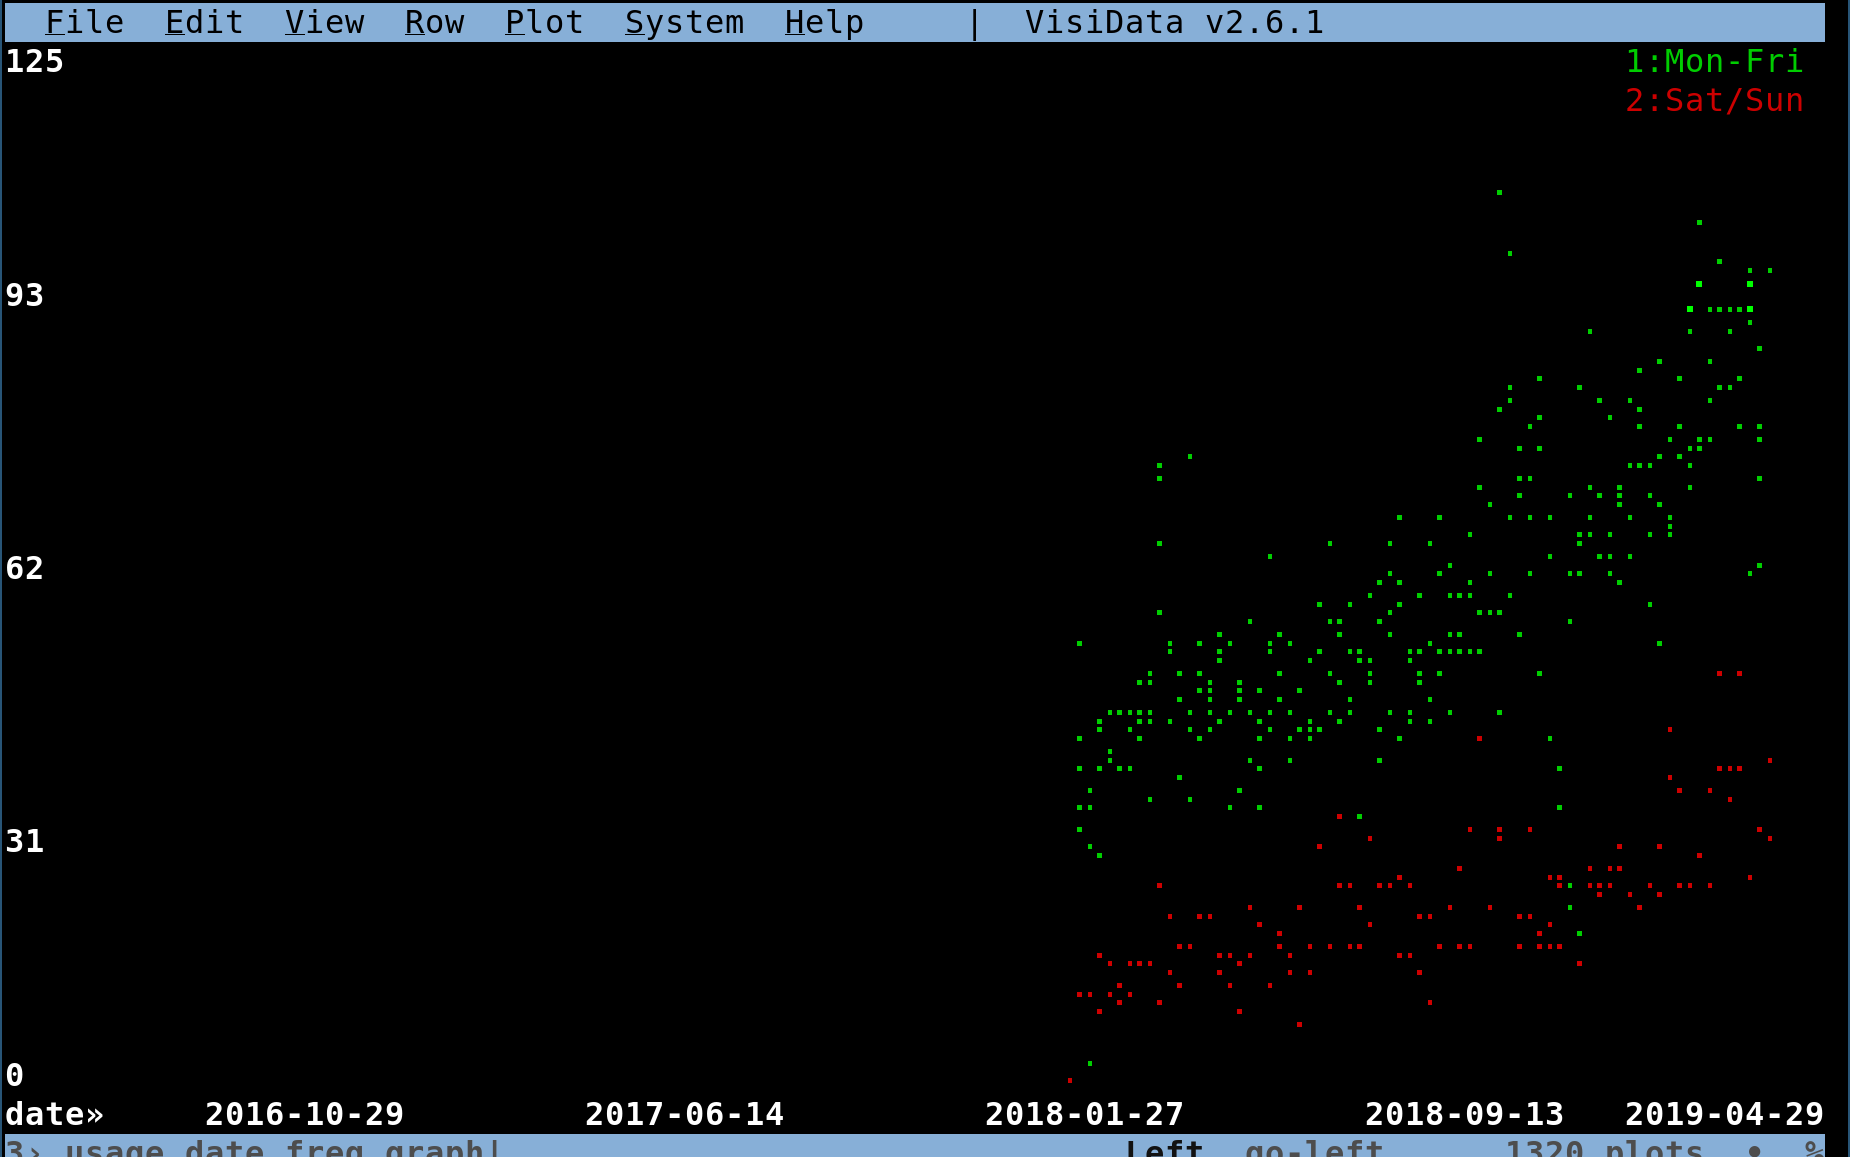
Here's what VisiData usage looked like for the first 2.5 years of its existence: from 40 daily M-F users in early 2018, to almost 100 in mid-2019.
Here's what the usage graph looks like now:
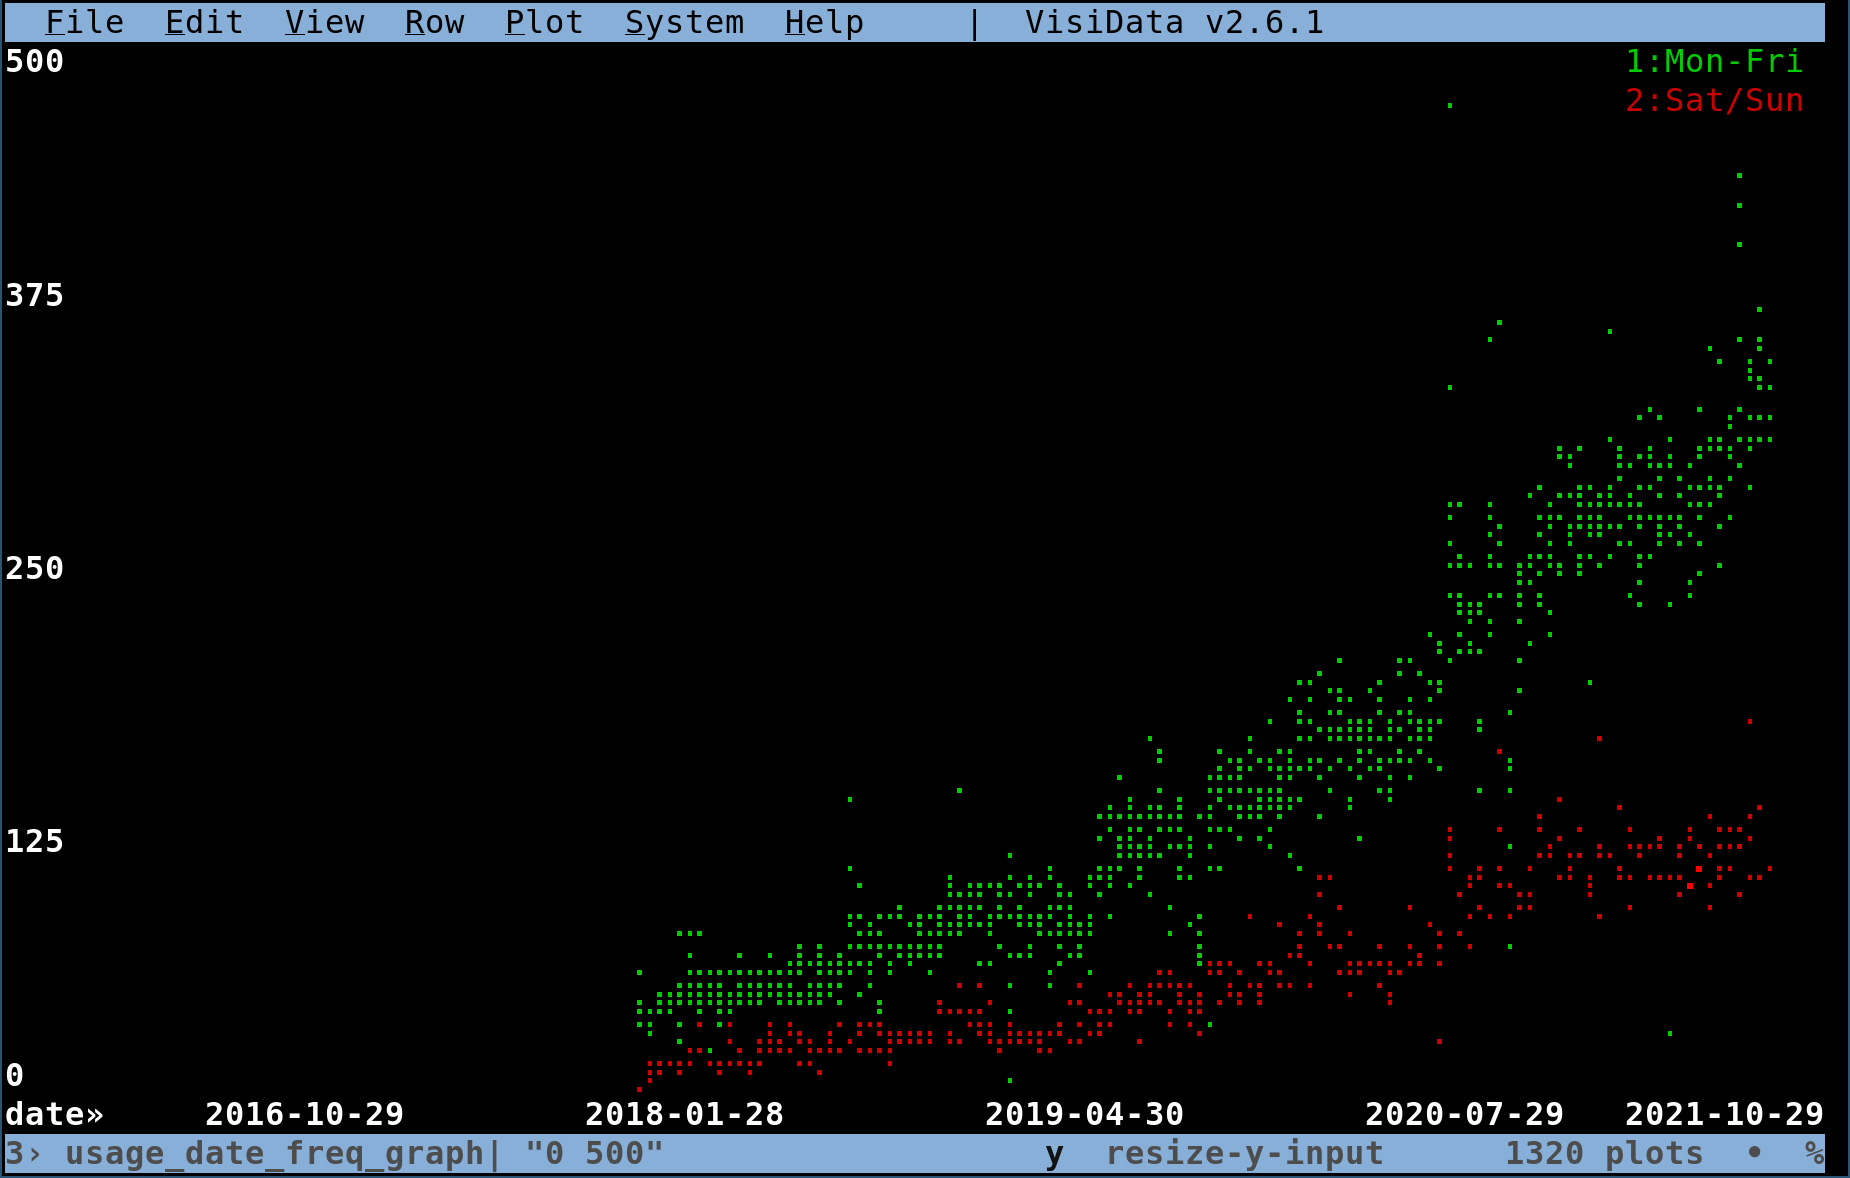
This graph above has 500 daily users on the Y axis. Let's extrapolate another 4x to 2000 and another 5 years:
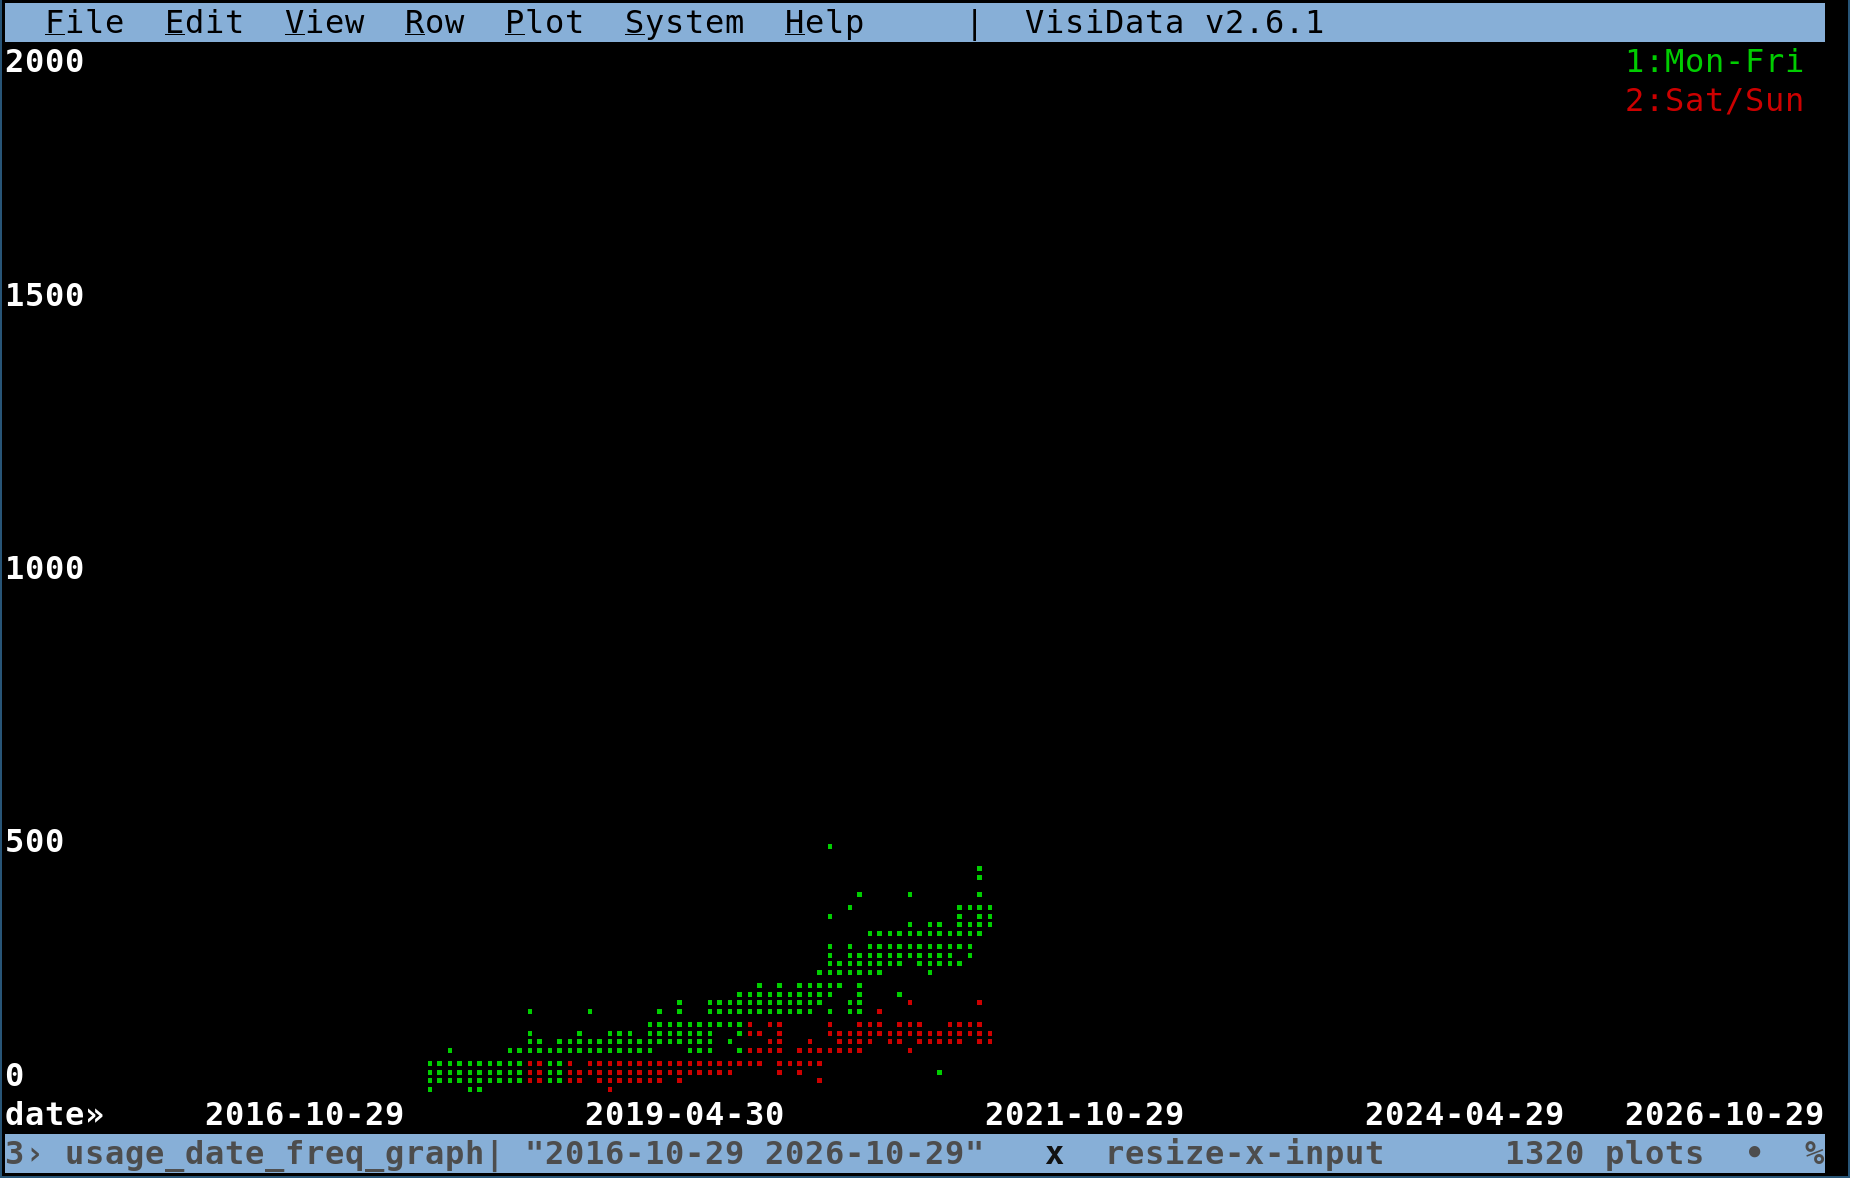
This graph makes even a "modest" 4x usage growth seem unlikely. But consider this next graph, which is the view in 2019 (2.5 years old and 2.5 years ago), until today), with the axes expanded to what they are today:
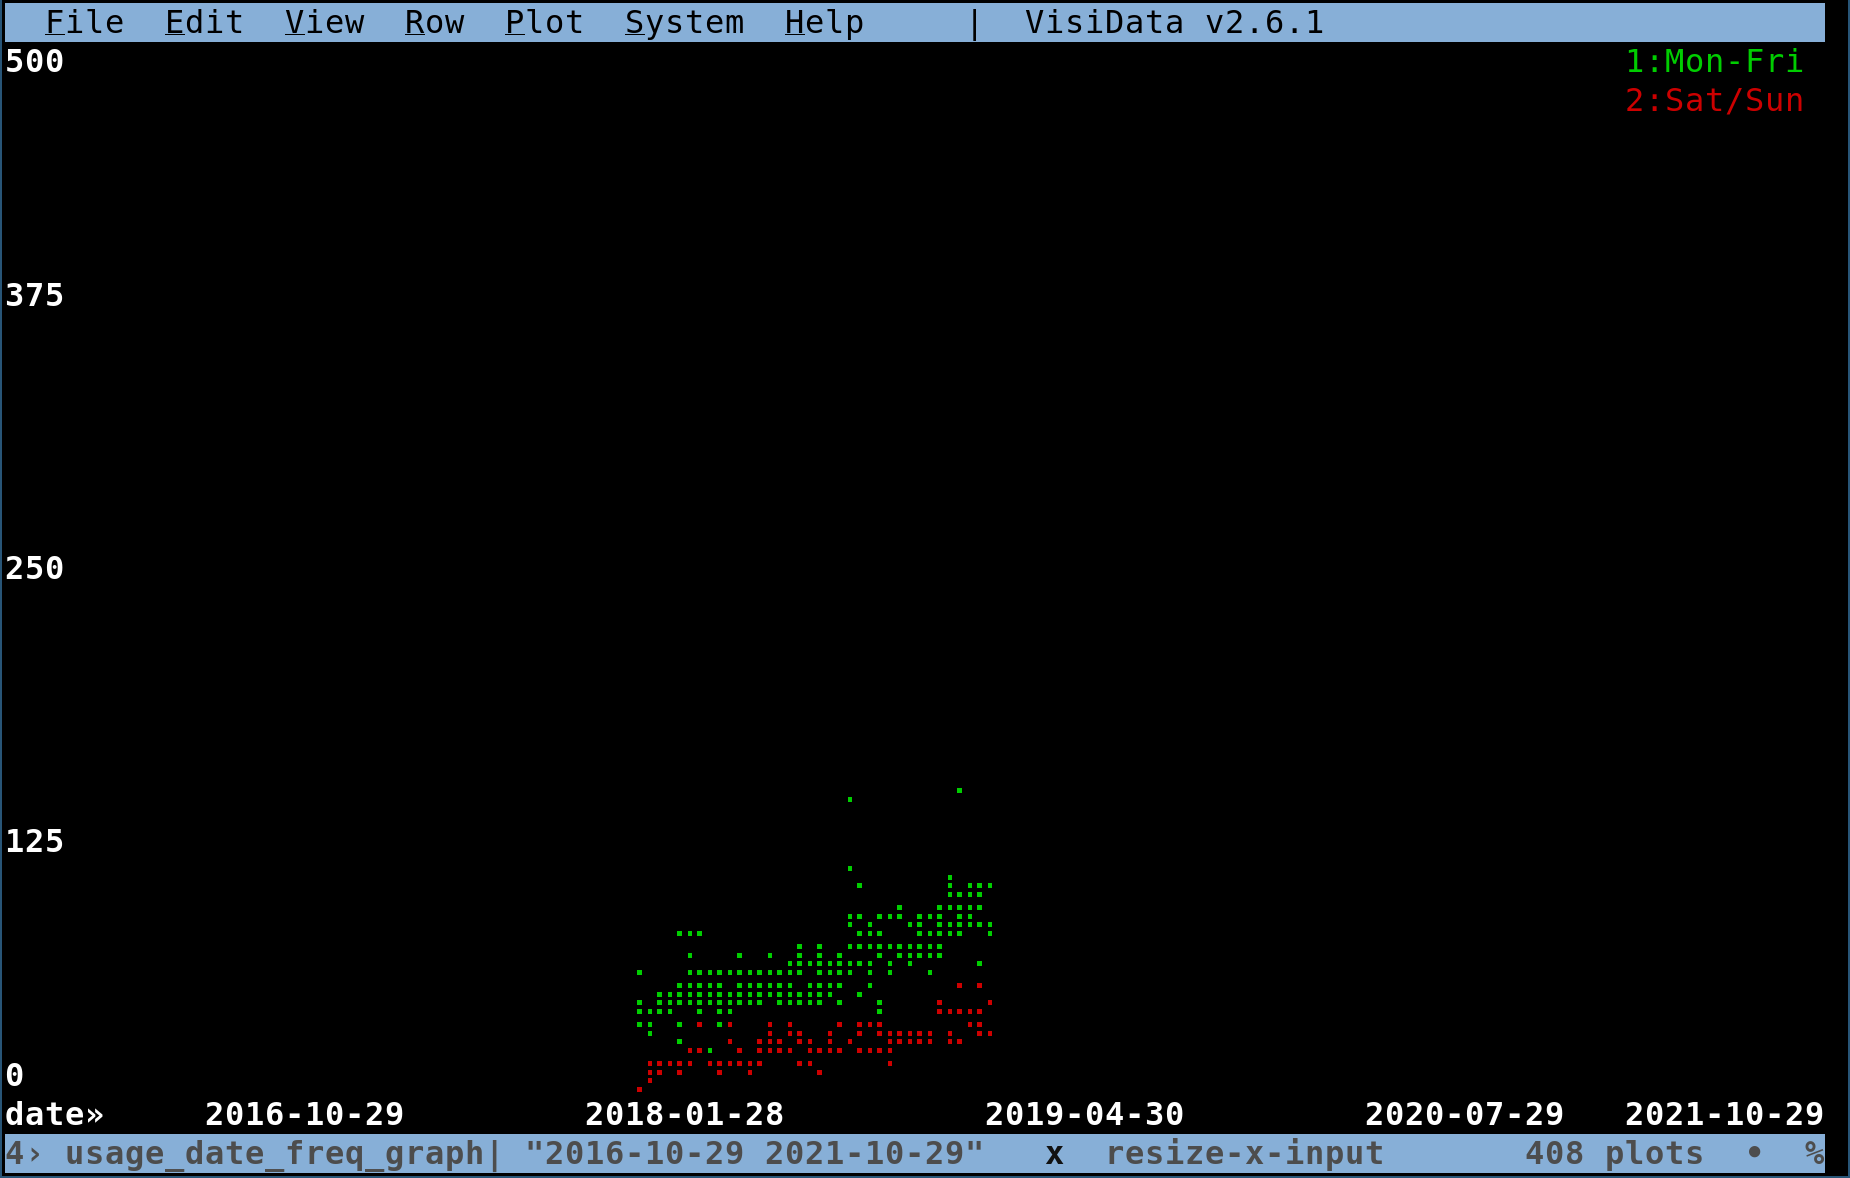
Its growth to today would have seemed as unlikely then, and yet here we are.
What will VisiData usage look like in 5 years? If it continues to double every year, then in 5 years that would be 32x; possibly exceeding 10,000 daily users! That seems a little excessive. But with millions of terminal users and millions of Python users and millions of data professionals who could benefit from a quick dive into a new dataset and whip it into shape, it's not impossible.